LOYALTY PROGRAMS
ACCURATE FINANCIAL REPORTING | PROGRAM VALUATION | PARTNER NEGOTIATION
Loyalty programs are used by most airlines, hotels, car rentals and many other retailers. The awards that these points are exchanged for are a significant liability for the companies responsible for them. Forecasting the future pattern of redemption is therefore important for business and regulatory reasons. AACG provides the accuracy needed to help loyalty point companies make better business and compliance decisions.
Your frequent flyer program or other loyalty program has a large number of unredeemed points outstanding. The dollar value of that liability depends critically on the fraction of points that will never be redeemed. That fraction, known as the breakage rate, is key to accurate financial reporting, program valuation, and negotiations with your partners. It is also under your control-changes to the expiry policy, reward offerings, and accumulation partners are likely to affect the breakage rate. How can you ensure that your breakage rate forecast is accurate and that the decisions you make will provide the results you seek?
Brokerage rate assumptions among the top-five U.S. frequent flier programs different by at least 12 percentage points. Each point translates into tens of millions of dollars.
– Source: 10-K filings of airlines in 2012
The AACG Approach
AACG’s scientific models and programs estimate the current breakage rate and its sensitivity to program rules or product development so that you can scientifically predict your loyalty points liability, and control that liability. AACG experts can help answer such questions as:
- What is your program’s long-term breakage rate? What is the breakage rate of currently outstanding points?
- What is the total profitability (margin plus breakage) of your customer segments?
- What is the breakage rate by issuing partner?
- What would happen to the breakage rate if you were to tighten your expiry rules? How will the new breakage rate affect your liabilities?
- What would happen to the breakage rate if you introduced a new redemption offering or changed the points required for an existing offering?
The Solution: Monte Carlo Simulations of Each Customer’s Future Accumulation and Redemption
Suppose your systems contained every transaction of every customer-not just historical transactions but also all future ones. Determining the breakage rate would then be a straightforward counting exercise. The hard part, of course, lies in getting future transactions. AACG can simulate those, separately for each individual customer, using Monte Carlo simulation techniques. The simulations of each customer’s accumulation and redemption behavior contain a systematic part, which is based on econometric model estimates of your program’s historical transactions. To reflect the random variations that occur across customers, it also contains a random component for each individual customer who is included in the breakage and liability estimates for future periods-hence the term “Monte Carlo” simulations.
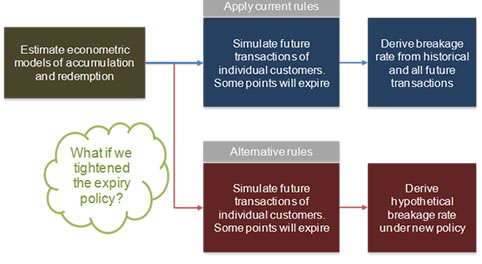
AACG’s typical breakage management project results in a software tool that remains with our client. The process starts with data gathering: historical transactions, customer characteristics, program rules, and a solid understanding of your business and its environment. AACG professionals construct an analysis file and develop econometric models of individual customers’ accumulation and redemption behavior. We simulate future transactions based on the econometric model and random disturbances. We generate a series of transactions that are projected to take place on future dates. Applying your program’s current expiry rules, we track when each customer’s future activity reaches the time when points expire or the customer is projected to disengage from the program. Given historical and the econometrically simulated future transactions, we derive the number of broken points for each customer. Aggregating over all customers (or over all customers in a particular segment), we then derive the overall (or segment-specific) breakage rate. The Monte Carlo simulation can produce both the most likely breakage outcome as well as the distribution that indicates the precision of those estimates. At this stage, it is straightforward to also estimate the average life of a point, that is, the average duration between point accumulation and redemption or expiry.
So far, the simulations took place under current program rules, in the current program environment, with the current partners and customer mix. But future transactions may also be simulated under hypothetical scenarios, such as an alternative expiry policy. This is where the advanced econometric models imbedded in re-usable software are indispensable. With a user-friendly interface, you and your co-workers may specify alternative scenarios and determine how sensitive the program’s breakage rates are to such scenarios.
Standard Static Approaches Fall Short
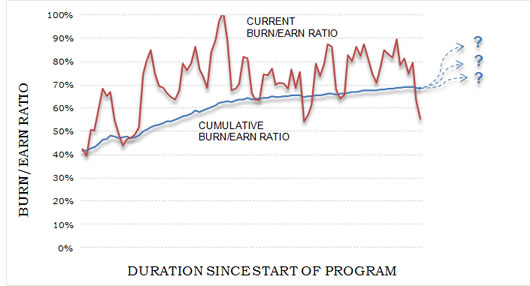
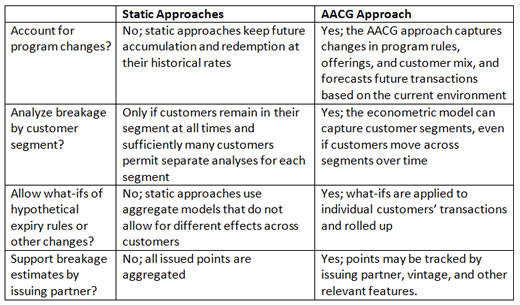
Static models have been used to estimate programs’ breakage rates. These methods typically group customers by the year in which they joined the program, calculate cumulative burn/earn ratios by cohort, assume that recent cohorts will follow the same maturity pattern as older ones, and extrapolate the cumulative burn/earn ratio to future years to derive the breakage rate. The methods require the often unrealistic assumption that accumulation and redemption behavior do not change over time despite changing customer mix, program offerings, and expiry rules. Also, these static approaches, often used by actuaries, are typically too crude to allow separate calculations by customer segment and do not support what-if simulations to measure the sensitivity of breakage rates to program rules and product development that you may be considering.


