Scientific Fraud Detection
The regulatory environment for investment management companies is becoming increasingly demanding. Regulators no longer consider spot checks sufficient to demonstrate compliance. The SEC has expressed clear preference for reliable compliance programs that allow companies to monitor their own activities. The U.S. Treasury is demanding greater oversight of hedge funds. Clients, in light of the Madoff Scandal, require credible assurance that their investments are safe from fraudulent activity.
Make Your Monitoring Program a Selling Advantage
Scientific Fraud Detection helps funds monitor regulatory compliance and identify fraudulent behavior. Its customized, rigorous statistical tests that help identify fraudulent behavior, including behavior related to trade allocation, portfolio pumping, front running and late trading. AACG’s experienced economists apply a unique methodology that uses internal and external data to detect aberrant trading patterns.
Statistical Tests – Examples of Trading Behavior
Because the issue at hand is one of monitoring and compliance, it is not sufficient to look at transactions on a one-off basis. Economists at AACG design statistical tests that offer robust ways of examining the data either across portfolio managers (PMs) or for a given portfolio manager.
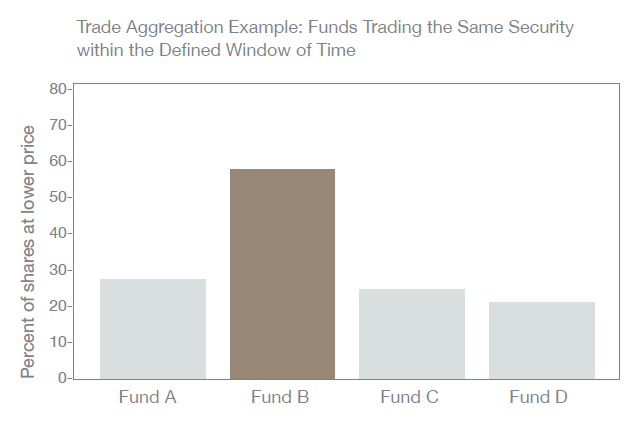
1. A company can check if one fund systematically benefited from a better price than other funds when they all traded in the same security on same day within a defined time interval. The graph to the right demonstrates a situation in which, of four funds that traded in the same security within a defined time interval, almost 60% of the shares purchased by Fund B were at a lower price.

2. A company can check if one fund systematically received a better price than another fund when they traded in the same security over a defined period of days. The charts below demonstrate two cases: one for two funds with the same PM (Funds A and B) and one for two funds with different PM’s (Funds B and C). In these cases, the threshold for the difference in dollar value is $100,000, the trading period is defined as 2-6 days, and the two funds had to have at least 50 transactions in the same security.

The first chart shows a situation in which Fund A would have had much higher values, had it been given the pricing Fund B received. Note that both funds are managed by the same portfolio manager. The second chart shows a situation in which Fund C would have had much higher values, had it been given the pricing Fund B received. In this example, Funds B and C are managed by different PMs. Using statistical tests and defining thresholds allows companies to test for systematic differences and to identify potential areas of concern.
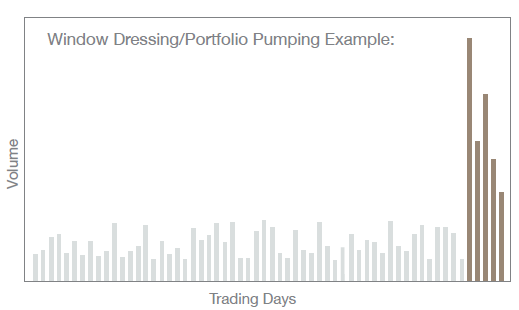
3. Portfolio managers may have an incentive to trade more near the end of the quarter in order to make their funds compliant with the prospectuses. One way to look for this behavior is to check for quarter-end activity that is statistically different from the rest of the quarter. The chart below shows spikes in activity at the end of the quarter that might be cause for concern. In addition to the examples illustrated above, other tests we can help design and implement include:
- Checking for Ponzi schemes
- Checking for front running
- Checking for late trading

To learn more, contact our regulations team using the links to the right, or email us at info@AACG.com.
